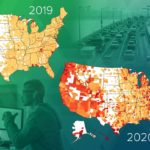
 The Covid pandemic forced many of us to hunker down at home for extended periods, with remote working a feature even when lockdowns were eased. Research from the Oak Ridge National Laboratory explores just how much our daily routine activities were changed during the pandemic.
The researchers tracked everything from getting our morning coffee to ordering a takeaway for dinner to understand how our behaviors changed during the early months of the pandemic. The researchers hope that their findings will help officials and policymakers better understand the way traffic patterns respond to crises and emergencies so that they can better react.
Tracking movement
The researchers were able to use data from SafeGraph, which provided millions of points of interest via GPS markers. The team were able to identify the times during each day when people were most active, and then compared these with pre-pandemic habits.
“We saw the largest differences in temporal and geographical behaviors during the morning and evening in 2020. With an increase in remote work and virtual schooling, we can see how people’s activities changed when normal commutes changed,” the researchers say.
Similar research was undertaken in the UK by a team from Oxford University, who developed a tool to track mobility during the pandemic.
The tool uses anonymized and aggregated mobile phone data to monitor the movement of people, with numerous interactive dashboards aimed to aid decision-making among policymakers and other officials involved in tackling the pandemic.
The data produces a number of fascinating findings. For instance, population movement since the start of March has fallen by 98%, with 55% of people staying at home on Easter Monday. The pandemic has also coincided with a fall in hospital footfall of a whopping 80%.
The data also revealed that the flow of people between different parts of the UK has fallen by 76%, whilst the best time to visit a supermarket appears to be 9 am on Tuesday morning.
Public data
The dashboards are freely available to the public, and allow people to view specific information about their region, including for particular National Health Service catchment areas.
“The monitoring of population movements in response to the COVID-19 pandemic has received considerable attention following its use in China, South Korea and Singapore, the countries where the virus impacted earliest,” the researchers explain. “The team came together to do what we could to help tackle the challenge facing the UK through the use of ethical big data analytics for the public good.”
They hope that data, such as their own, can be crucial in effectively fighting the coronavirus outbreak, as it can allow measures, such as social distancing, to be applied as effectively as possible, thus saving lives whilst keeping disruption to a minimum.